
Self-service analytics gives business leaders direct access to their data without requiring a data engineer for every question. It combines connected data sources, consistent metric definitions, and a natural language interface so any leader can ask questions and trust what comes back.
I ran engineering teams for a long time before I ran a company. I built dashboards, broke dashboards, and spent more nights than I’d like debugging why two dashboards showing “the same metric” disagreed with each other. Now I run demos most weeks with COOs and CFOs at scaling companies, so I hear this problem live, not secondhand.
Almost every one of them has the same setup. Dashboards. Reporting tools. At some point, an entire data team whose full time job is making sure leadership has numbers.
And yet every Monday, every board meeting, every quarterly review, the same thing happens. A number lands. Then the follow up questions start.
Why is churn up? Is this seasonal or structural? Which segment? Does finance see the same thing?
That’s when the scramble starts. A Slack message to RevOps. Someone quietly pulling a custom query. Four versions of a spreadsheet that don’t quite match. By the time you have an answer you trust, four days have passed and the window to actually act on it has mostly closed.
Most BI tools were built to deliver a number fast. Whether that number is right, and whether it survives the next question, is a different problem entirely, and it’s the one nobody built for.
Why BI gives you a number, but not one you can trust
Traditional business intelligence tools centralize data, surface it visually, and let you slice it by dimension. That’s genuinely useful, and it’s also where the trust problem starts. A number can be accurate and still be wrong for your business, because nobody agreed on what “churn” or “revenue” actually means underneath it. The follow up question, the one that needs context and cross referencing and an actual understanding of how a metric was calculated, is where that gap becomes impossible to ignore.
Where BI stops, self-service analytics picks up. Instead of serving static charts, it builds a live, queryable model of your business. One your C-suite can work with directly, in plain language, without routing every question through a data engineer.
What is self-service BI?
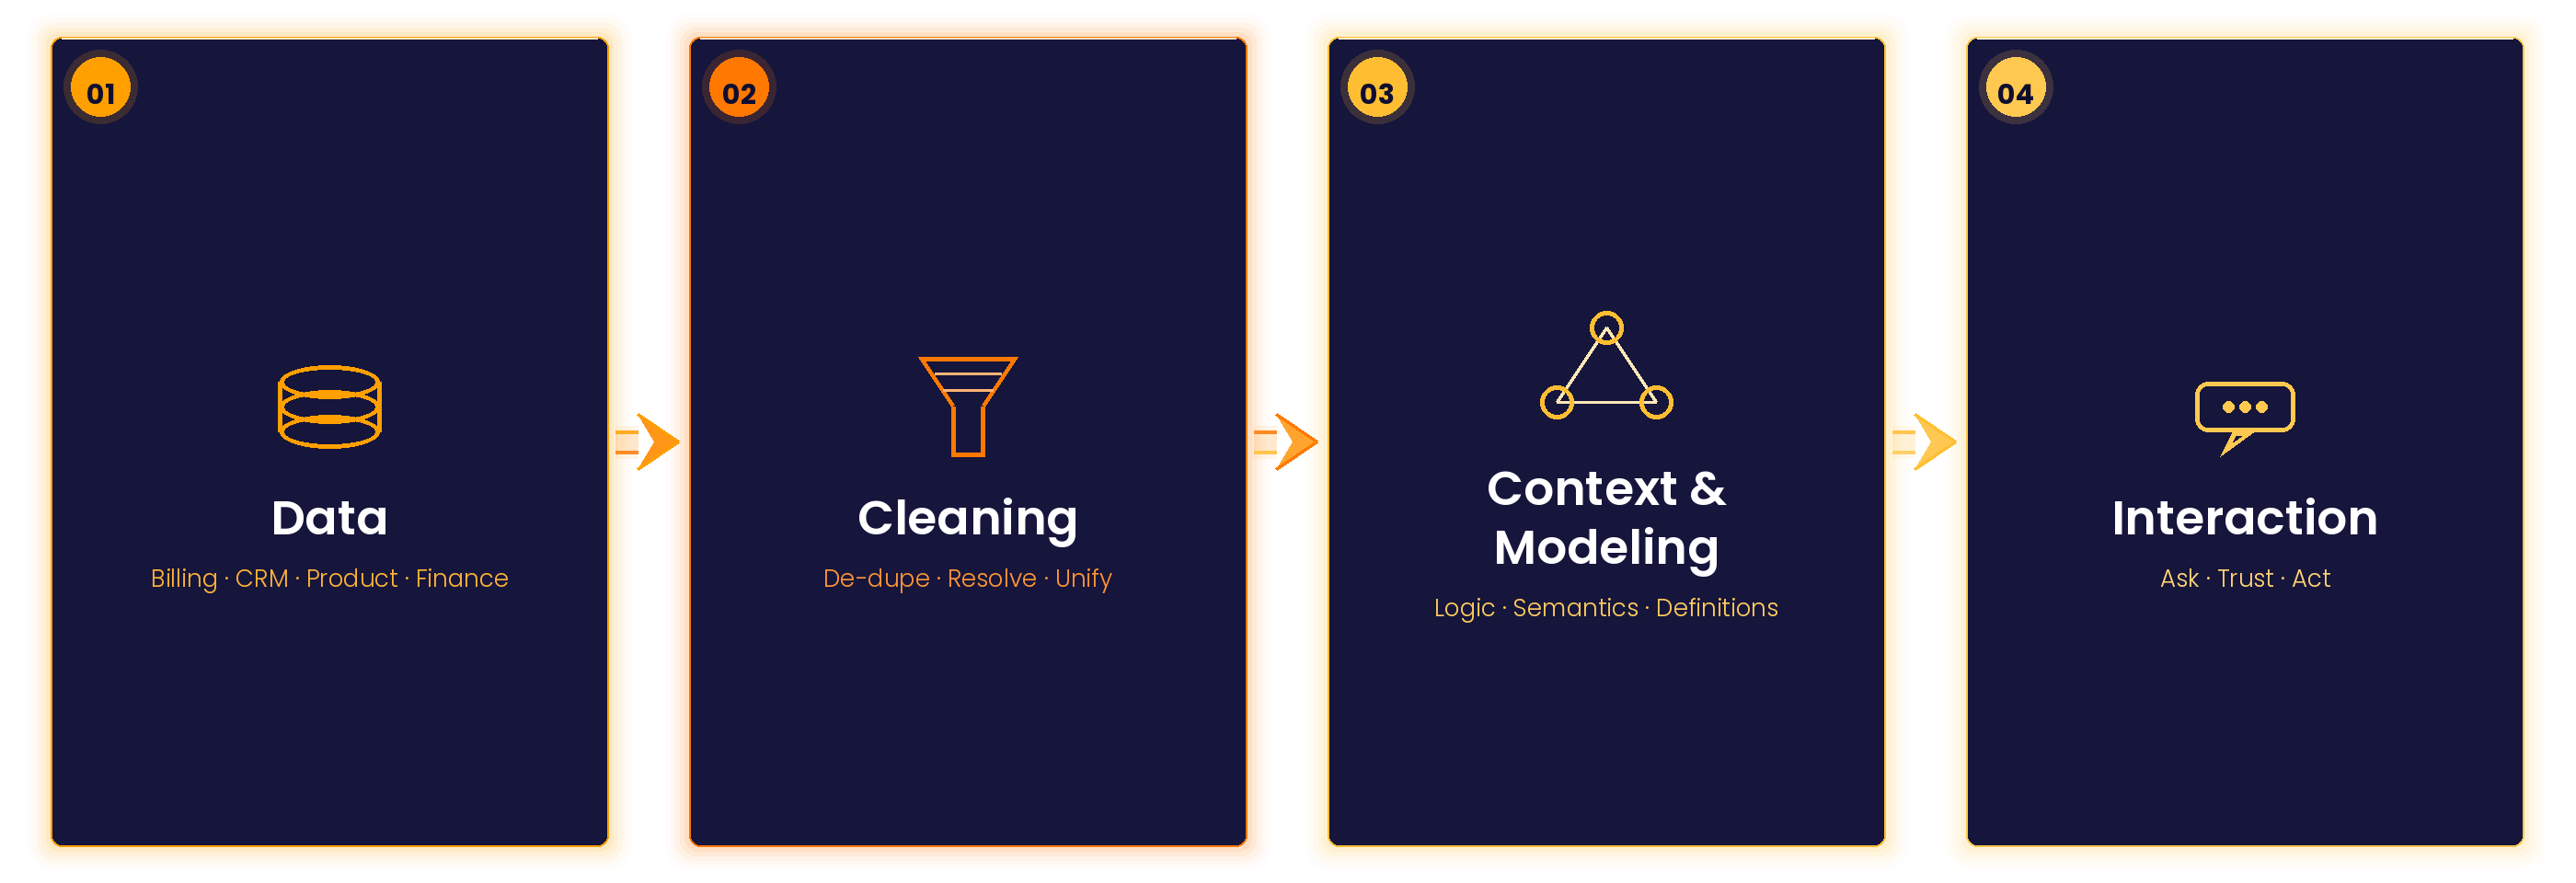
Here’s what I’ve seen after enough demos and enough client conversations. Most tools solve exactly one of these layers and stop. Plenty of AI tools nail Layer 4. The interaction feels like magic. But without Layer 2 and 3 underneath it, you get a fast, confident answer to the wrong question. Some platforms hand you Layer 1 exports and call it done. Others connect 1 and 4 and skip the cleaning and context entirely, which is how you end up with three different revenue numbers, each delivered with total confidence. The cleaning and context layer is the unglamorous part, and it’s also the part that makes the other two worth having.
Most companies we talk to haven’t actually scored themselves on this. If you want a straight answer on where your own data foundation stands before you put an AI tool on top of it, we built a free AI readiness assessment.
The shift from intuition led to system led decisions
The systems built to fill this gap often end up just as broken. They answer yesterday’s questions. They need expensive engineers and specialists to keep running. And they create a new kind of dependence, not on gut instinct anymore, but on whoever wrote the SQL query and whoever can re explain the methodology every quarter.
That’s a different version of the same bottleneck. It just comes with a Tableau license attached.
What I actually hear in the room
I’ve sat in enough client calls to notice the patterns. A few things come up again and again, almost word for word, from COOs, CFOs, and operators at scaling companies:
“Every follow up forces people back into manual view and interpretation.”
“We can answer the first question. The second one is where we stall.”
“The BI tool technically works. It just quietly requires a team to maintain it.”
“Alignment on reality, that’s what we’re always chasing.”
That last one gets said more than any other, in almost those exact words.
What good self-service analytics looks like
The companies getting real value from their data have stopped treating it as a reporting function. They treat it as decision infrastructure. Their C-suite can ask a question and trust what comes back. Reporting that used to take three days happens in minutes. A board question gets answered in the room instead of in a follow up email a week later.
When the COO pulls their own numbers, the head of finance runs their own scenarios, and the CEO walks into a board meeting with data from that morning, something shifts. Data stops being something you retrieve on request and starts being part of how the business actually runs.
Getting there has historically cost a fortune in time and money, and if you’ve never had to live through it, count yourself lucky. You start with a tool. Then a person to run it. Then a team. Then more tools. Eventually you’re paying for a warehouse, spending months integrating it, and looping in three or four other teams: BI, engineers, consultants, funnel experts, plus still more tools just to turn raw numbers into something a business leader can actually trust and use. It adds up to roughly a million dollars and a year or more before anyone trusts the numbers.
That’s what self-service analytics for business leaders is supposed to fix. Not by making a data team faster, but by making it unnecessary. You get the answers a data team would give you, without ever having to build one.
Your C-suite shouldn’t need a data team to get a straight answer. That’s the whole reason we built Pliable.
We connect your data, clean it, and give your leadership team a way to ask questions and actually trust what comes back. No engineers on standby, no fire drills, no waiting until Thursday for an answer you needed Monday.
Book a free call with our founder (me) to talk through your data needs. No hard sell, just a conversation.